Como Ativar a Escuta Online e o Sussurro de Chamadas
Como Conceder Acesso aos Funcionários
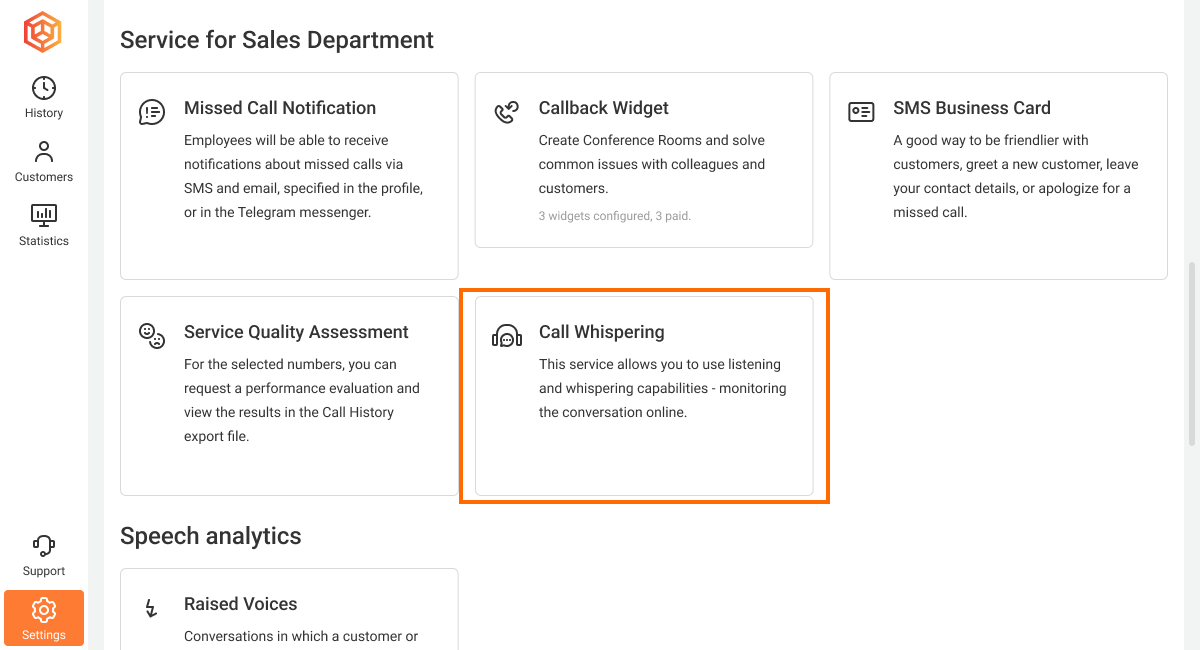
Vá para a aba Mais nas configurações da sua PABX em Nuvem. Lá, encontre a seção Serviço para o Departamento de Vendas e a opção Sussurro de Chamadas.
Selecione um funcionário que poderá ingressar nas chamadas. Se pretende escutar e sussurrar chamadas ativas você mesmo, especifique também o seu perfil.
Se vários funcionários precisarem de acesso ao Sussurro de Chamadas, clique em Adicionar funcionário.
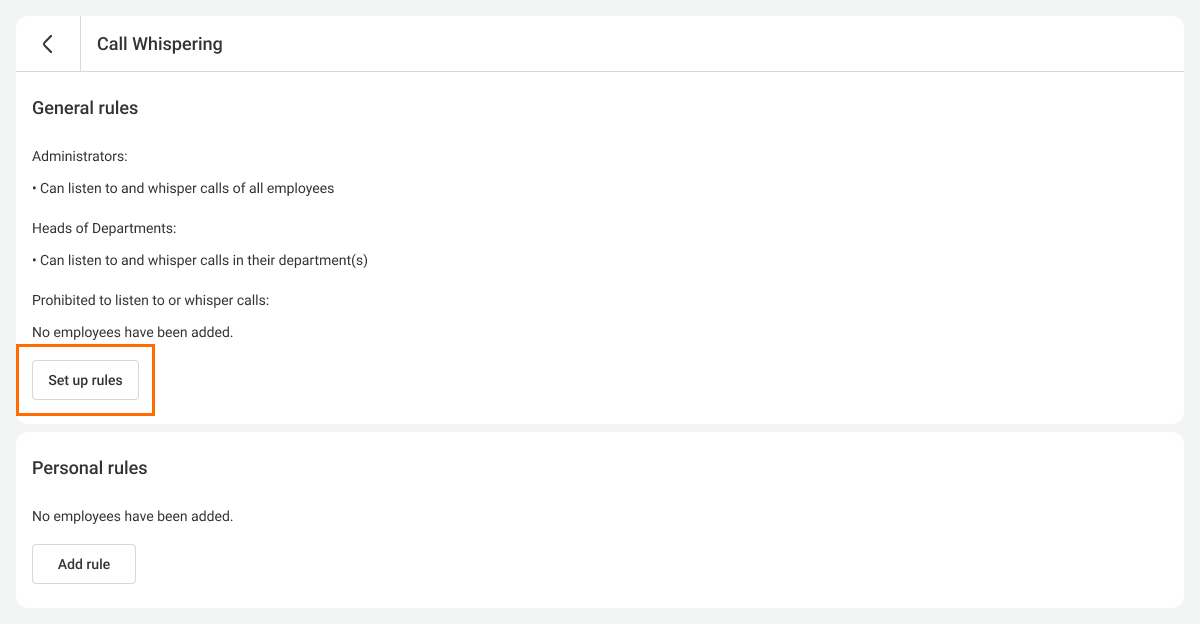
Selecione os funcionários cujas conversas não poderão ser escutadas ou sussurradas. Isso pode ser, por exemplo, um CEO ou um contador.

Clique em Salvar.
Atenção: um funcionário com qualquer nível de permissão, a quem você conceder acesso ao sussurro de chamadas nas configurações, poderá monitorar todas as chamadas ativas da empresa, escutar e sussurrar chamadas.
Como Conectar-se a uma Chamada
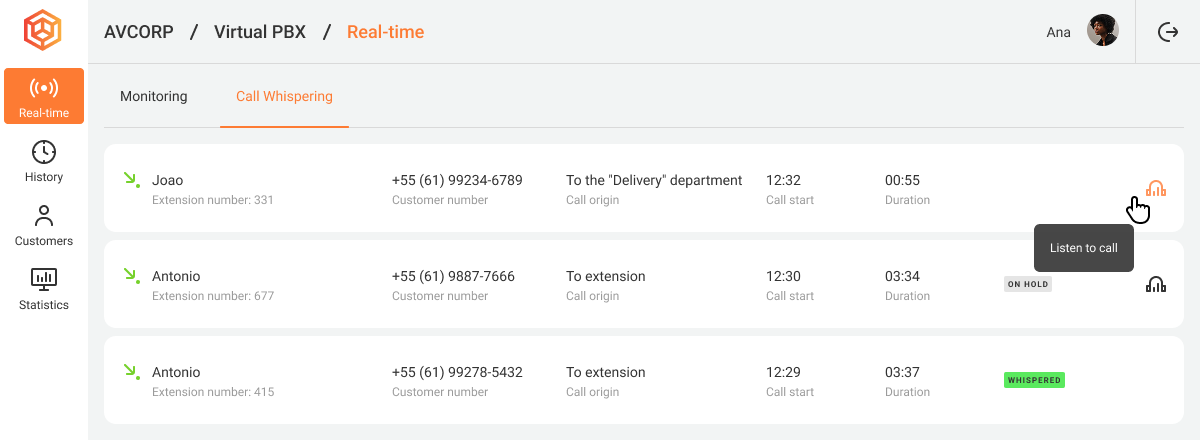
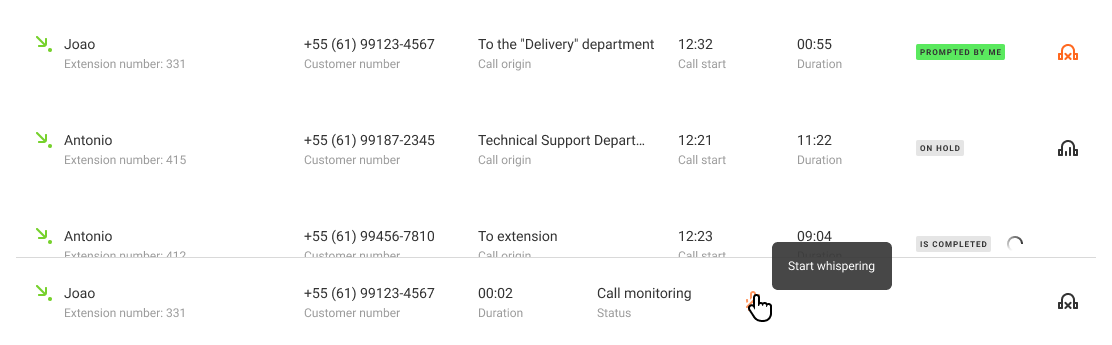
Para saber quais funcionários estão falando ao telefone e com quem, vá até a aba Sussurro de Chamadas e selecione uma chamada sem status ou com o status Em Espera.
Existem duas formas de se conectar a uma chamada para sussurrar:
- via navegador;
- discando uma combinação de teclas no Communicator ou em um telefone SIP.
Vamos analisar cada opção em detalhes.
1. Conexão via Navegador
Selecione a chamada desejada e clique no ícone de fones de ouvido à direita.
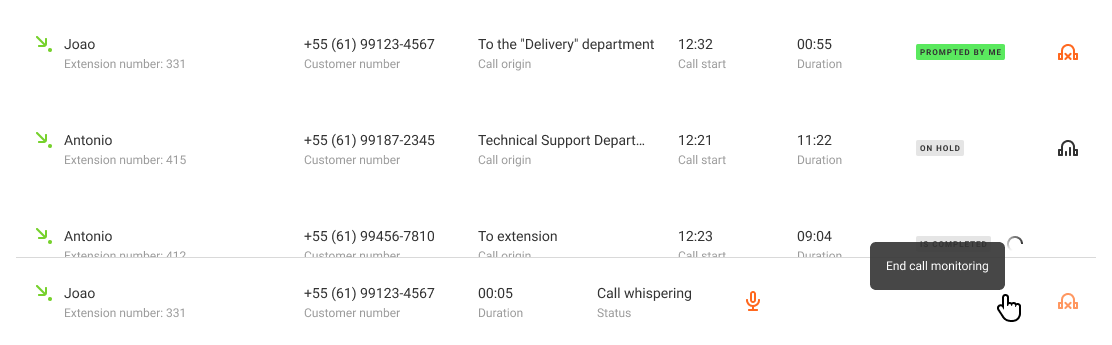
A chamada à qual você se conectou ficará fixada na parte inferior da tela. Aqui você verá informações principais: nome do funcionário, número do cliente, há quanto tempo você está conectado à chamada e o status (escutando ou sussurrando).
Para começar a sussurrar, clique no ícone de microfone riscado no painel inferior.
No modo de Sussurro de Chamadas, o ícone do microfone ficará verde — um simples olhar na cor do ícone será suficiente para entender se o funcionário pode ouvi-lo. Para silenciar o microfone, clique novamente neste ícone.
Você pode sair da chamada com um clique. Para isso, clique no ícone de fones de ouvido no painel inferior.
Para alternar para outra chamada, basta clicar no ícone de fones de ouvido ao lado da chamada desejada.
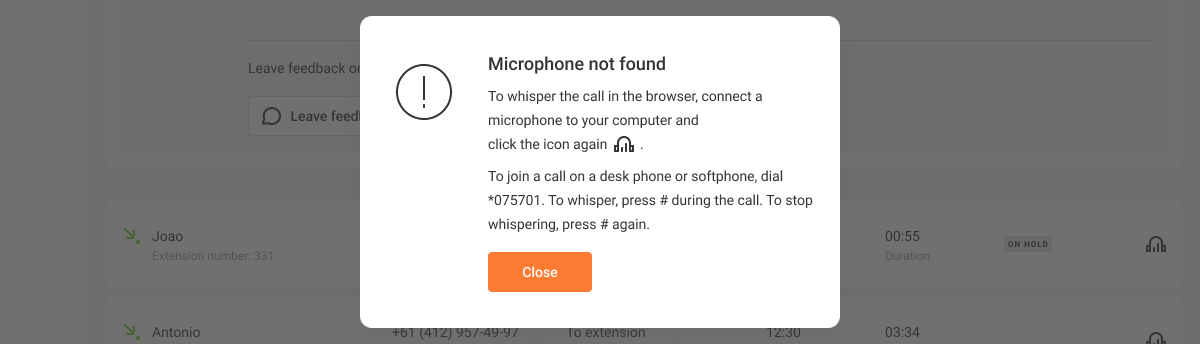
Atenção: só é possível escutar e sussurrar uma chamada pela interface se um microfone estiver conectado ao seu computador. Caso contrário, ao clicar no ícone de fones de ouvido, aparecerá a seguinte notificação:
2. Conexão a partir de um Telefone ou Softphone
Antes de se conectar a chamadas ativas via Communicator ou telefone SIP, recomendamos que você primeiro selecione a chamada desejada através da interface web da PABX em Nuvem. Se conectar “às cegas” pelos ramais dos funcionários, você pode cair em quem não está em chamada e perder mais tempo procurando uma chamada ativa.
Para escutar uma conversa, disque *075 [ramal]. Atenção: o número de ramal do funcionário está listado logo abaixo do nome dele na lista de chamadas ativas.
Para sussurrar durante a chamada, disque #.
Para parar de sussurrar, pressione # novamente. Para sair da chamada, basta desligar.